← Research

Fluid Inclusions in Halite as Archives of Ancient Seawater Chemistry
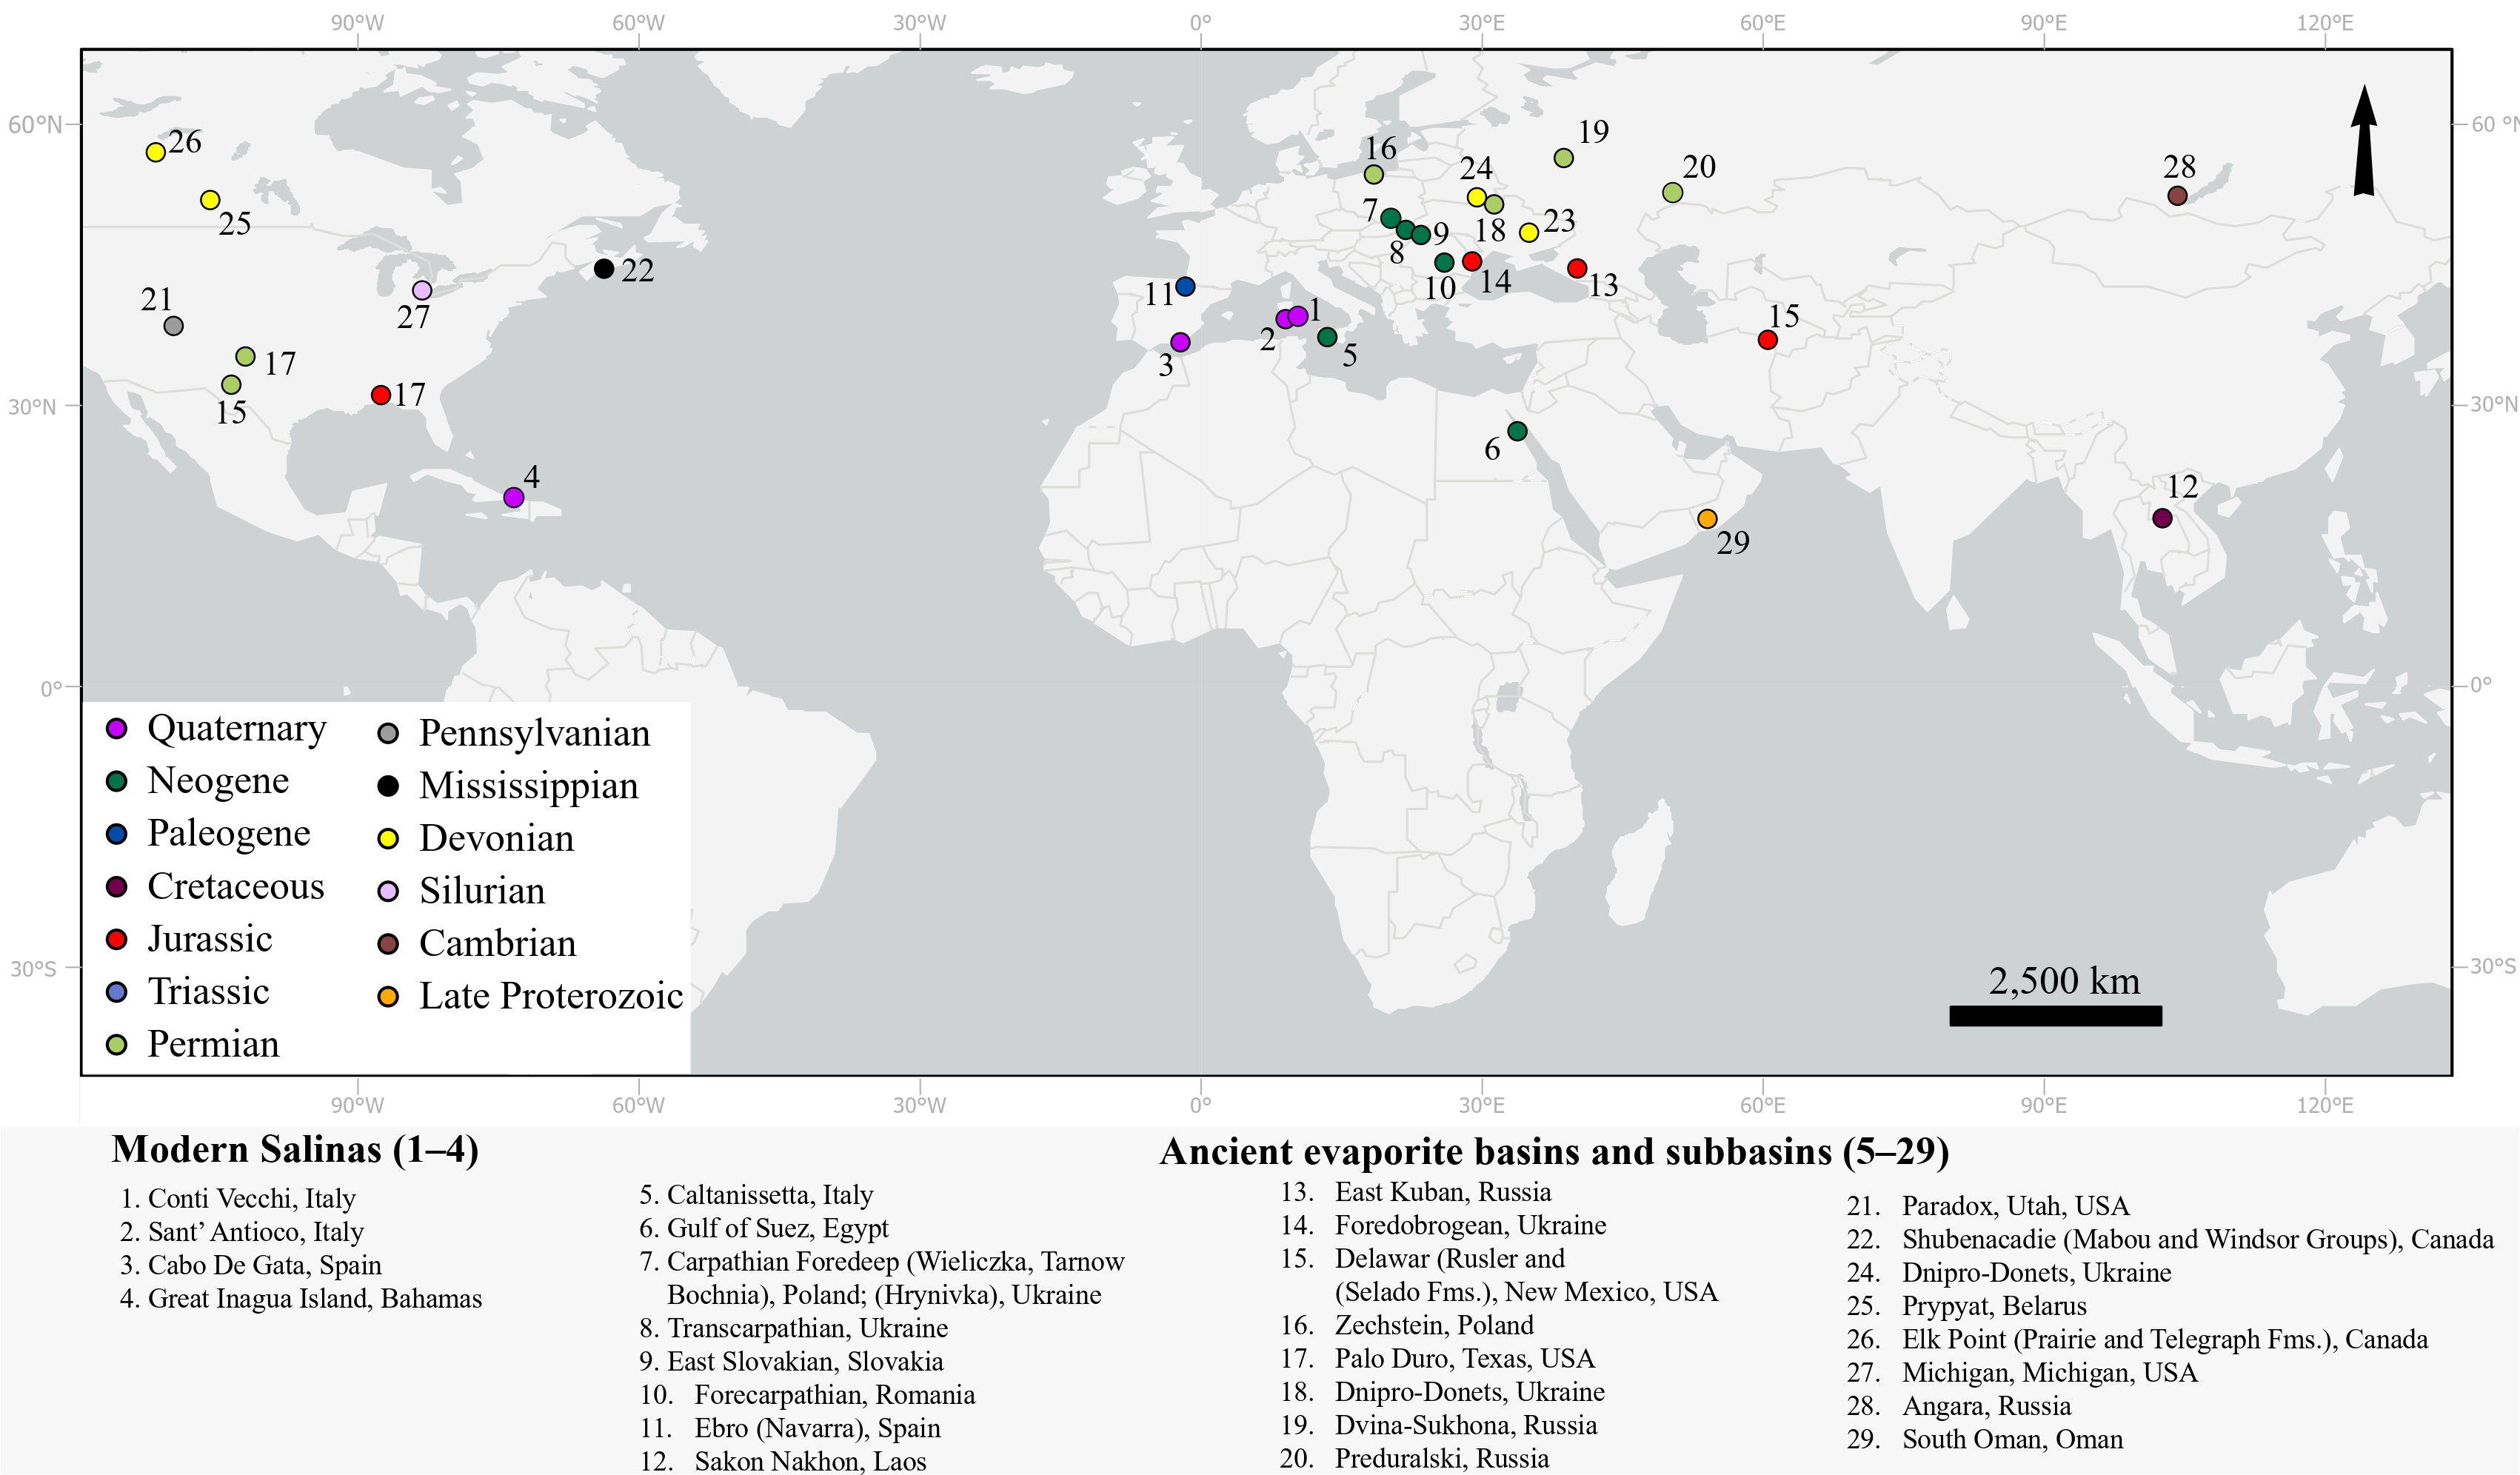
Global distribution of marine evaporite deposits
Map showing global distribution of marine evaporite deposits analyzed in this study.

Fluid inclusions in marine halite are micrometer-scale (picoliter volumes) droplets of evaporated seawater sealed inside the salt as it grew, and they preserve the most direct record of ancient ocean chemistry available. I developed a combined LA-ICP-MS and cryo-SEM-EDS technique and measured the major, minor, and trace elements in single fluid inclusions with detection limits as low as 1 ppb (Weldeghebriel et al., 2020). Applying it to more than 1,300 inclusions from ~30 marine evaporite basins, I built records of seawater Mg/Ca, [Ca²⁺], [SO₄²⁻], [Sr²⁺], and [Li⁺], and δ⁷Li over the past 550 million years (Weldeghebriel et al., 2022, 2023; Weldeghebriel and Lowenstein, 2023; Weldeghebriel et al., in review).

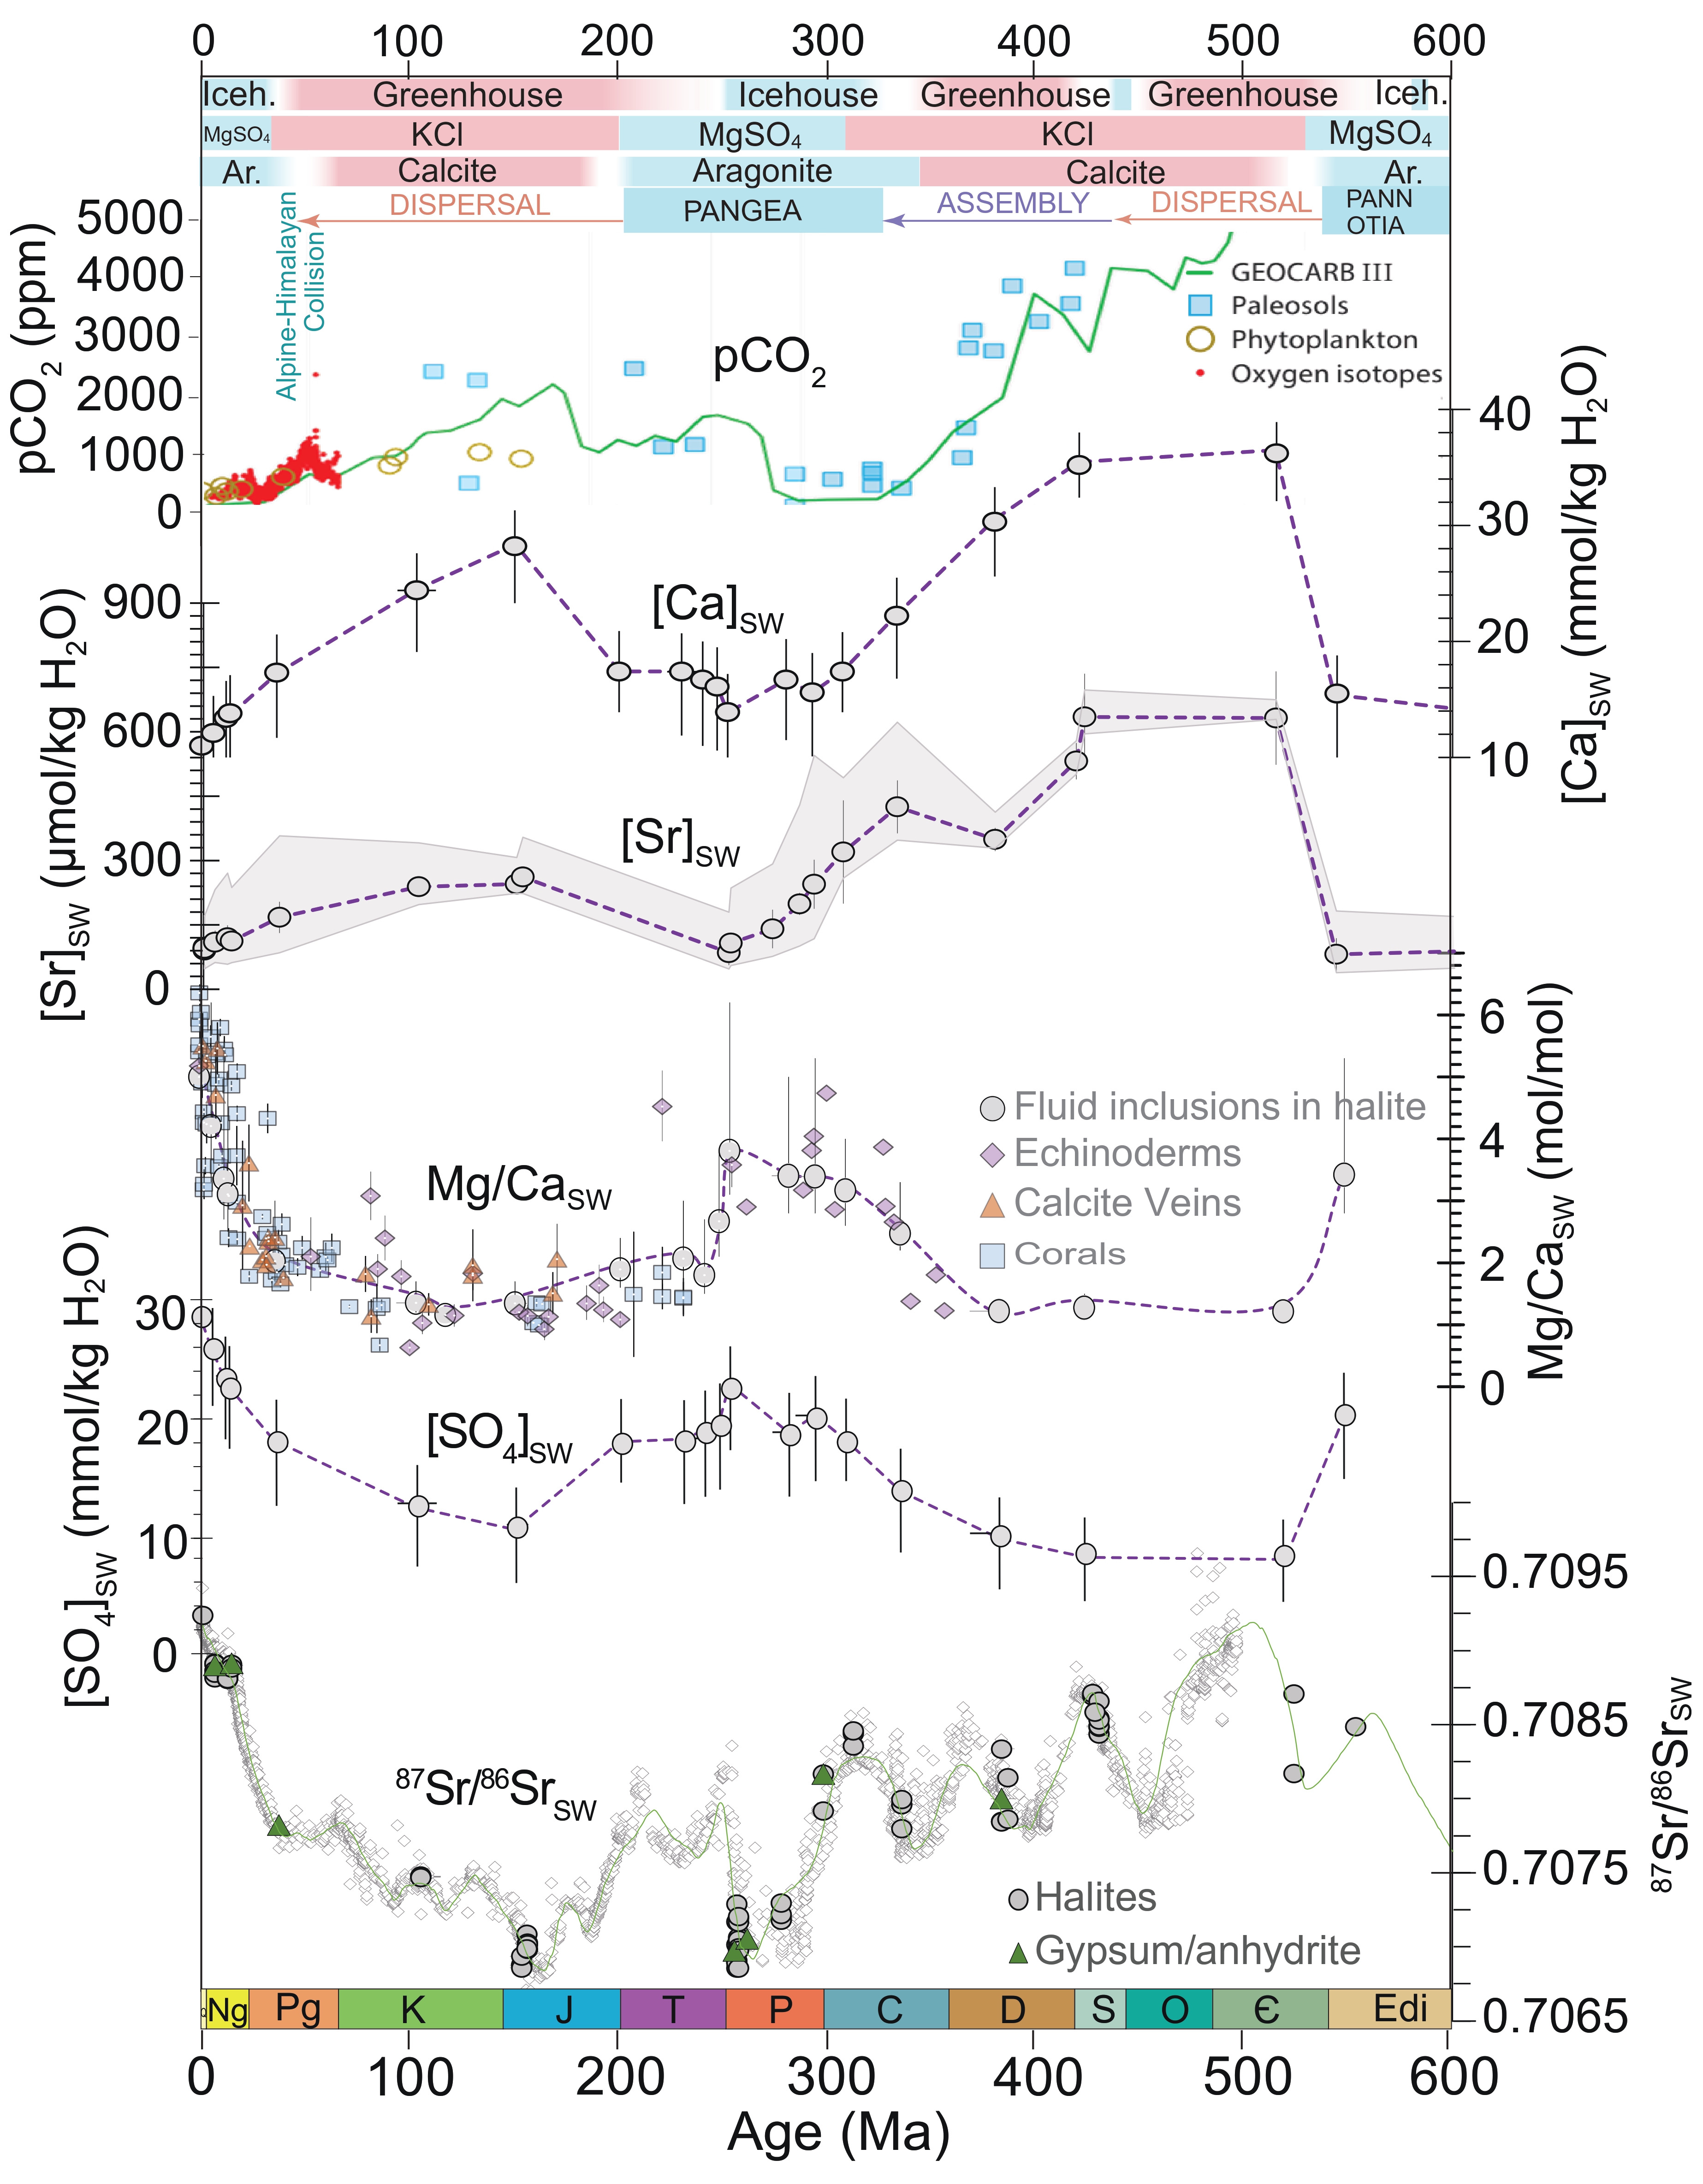
These records are dominated by ~100-Ma oscillations that co-vary with major Earth system transitions, including the mineralogy of marine carbonate shell-building organisms (aragonite vs. calcite), potash evaporites (MgSO₄ vs. KCl), greenhouse–icehouse climate oscillations, and eustatic sea level. Icehouse climate intervals are associated with low atmospheric CO₂, greater subaerial exposure of continental shelves, high seawater Mg/Ca ratios, [SO₄²⁻] and δ⁷Li, low seawater [Ca²⁺], [Sr²⁺], [Li⁺], widespread aragonitic reef-builders and skeletal algae, and the deposition of MgSO₄-type potash minerals in marine evaporite basins. Greenhouse climate intervals show the opposite pattern: elevated atmospheric CO₂, widespread continental flooding, low seawater Mg/Ca ratios, [SO₄²⁻] and δ⁷Li, high seawater [Ca²⁺], [Sr²⁺], [Li⁺], predominantly calcitic marine precipitates, and KCl-type potash evaporites.
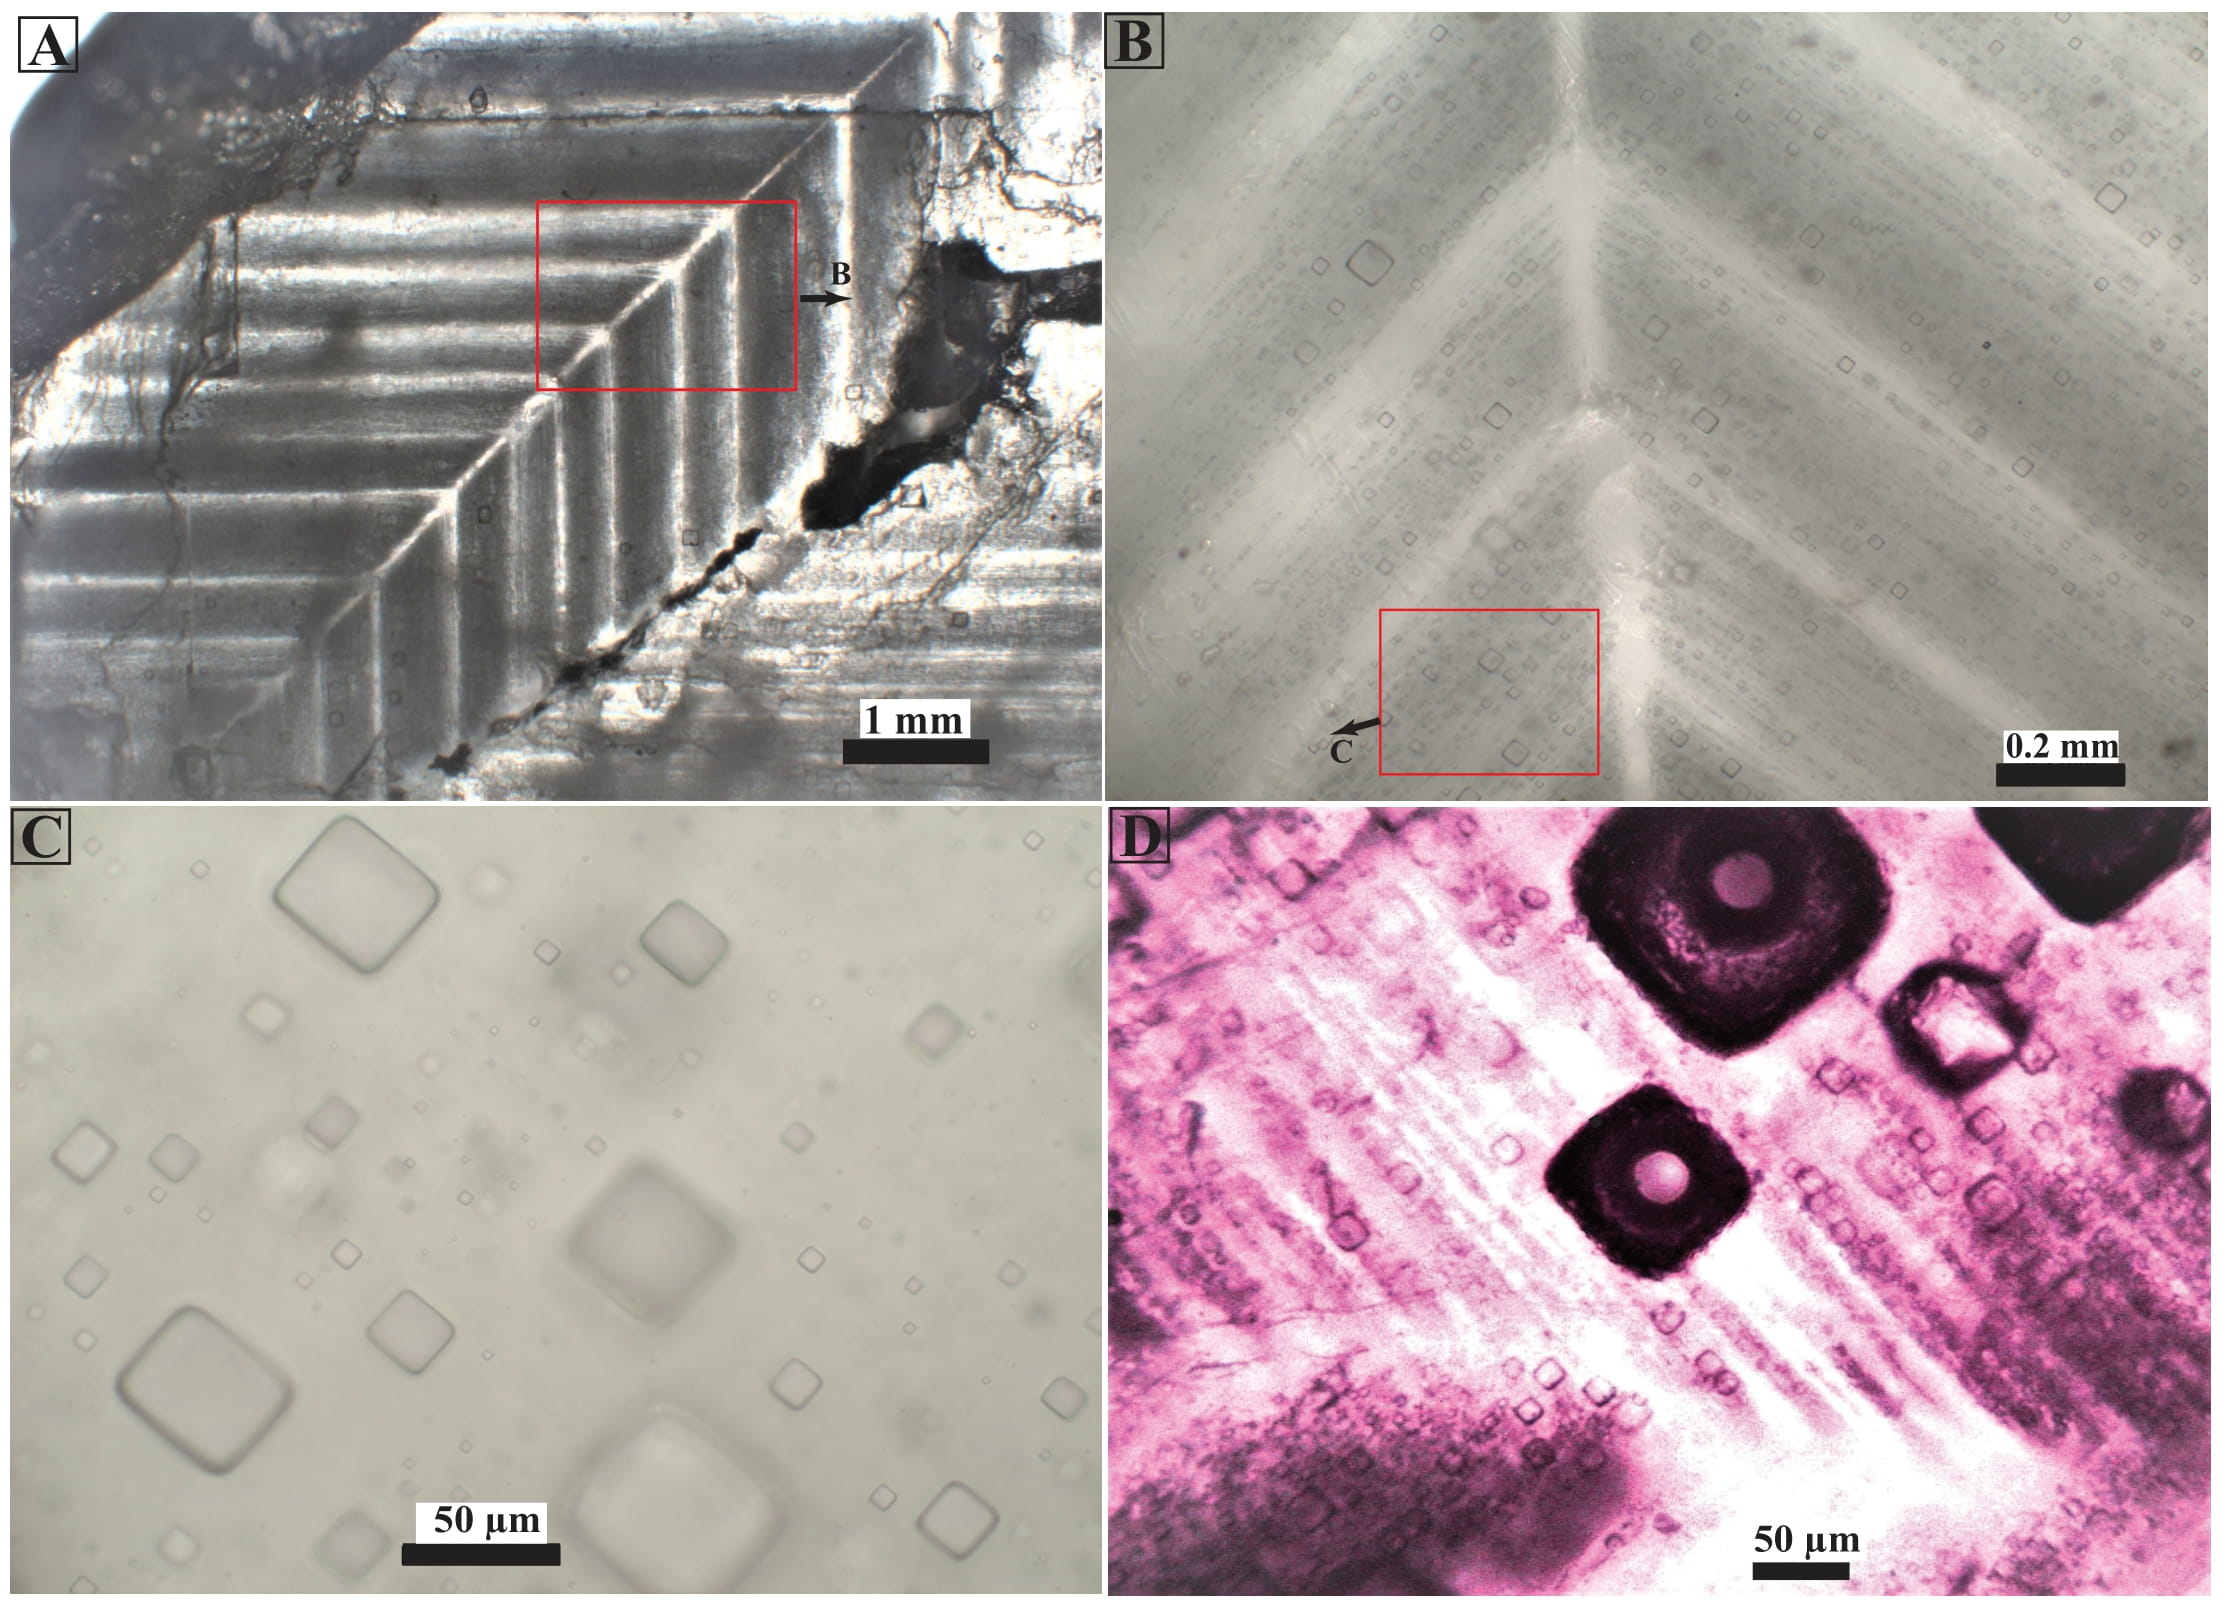
Fluid inclusions along chevron growth zones in halite
Photomicrograph of halite crystal from Serravallian-Tortonian (~11.8 Ma) Gulf of Suez, Hurghada, Egypt, A) showing vertically oriented chevron crystal with dark and light bands; B) dark banded part of chevron structure contains a large number of primary fluid inclusions; C) close up view shows individual fluid inclusions with negative cubic shapes and varying size from 3 to 80 μm. D) Large fluid inclusions ablated by laser appear dark after fluid extraction..
Phanerozoic seawater and CO2 record
Secular variation in Phanerozoic and Neoproterozoic atmospheric pCO₂ and seawater [Ca²⁺], [Sr²⁺], Mg/Ca, [SO₄²⁻], and ⁸⁷Sr/⁸⁶Sr. From top to bottom: reconstructed atmospheric pCO₂ using selected proxy data and the GEOCARB III model (adapted from Turchyn and DePaolo, 2019); reconstructed seawater [Ca²⁺], [Sr²⁺], and [SO₄²⁻] from fluid inclusions in marine halite (Weldeghebriel et al. 2022, 2023, and references therein); Mg/Ca from fluid inclusions in marine halite (Weldeghebriel et al. 2022, and references therein), fossil echinoderms (Dickson, 2002), corals (Gothmann et al., 2015), and calcite veins (Coggon et al., 2010); ⁸⁷Sr/⁸⁶Sr: light gray diamonds (Prokoph et al., 2008) and dashed curve (McArthur, 2010) show ⁸⁷Sr/⁸⁶Sr from marine non-skeletal carbonates and fossil shells; circles show ⁸⁷Sr/⁸⁶Sr values from fluid inclusions in marine halite (Weldeghebriel et al. 2023) and triangles from sulfates interbedded with halite. Both lie on the marine curve, supporting the seawater origin of the brines from which halite precipitated. Dashed lines are best fit trends and shaded envelope ([Sr²⁺]) represents 95% confidence interval. Error bars show data uncertainty at 1σ (1SE for [Sr²⁺]SW). Horizontal bars show MgSO₄ (blue) and KCl (peach) evaporites (Hardie, 1996), calcite (peach) and aragonite (blue) seas (Sandberg, 1983), and greenhouse (peach) and icehouse (blue) climates (McKenzie et al., 2016). Arrows denote intervals of supercontinent cycle phases (breakup and assembly) from Frizon De Lamotte et al. (2015) and Kroner et al. (2021).

Related publications